Anatomy of AI Observability
Traces, metrics, evals, drift detection, and regression alarms.
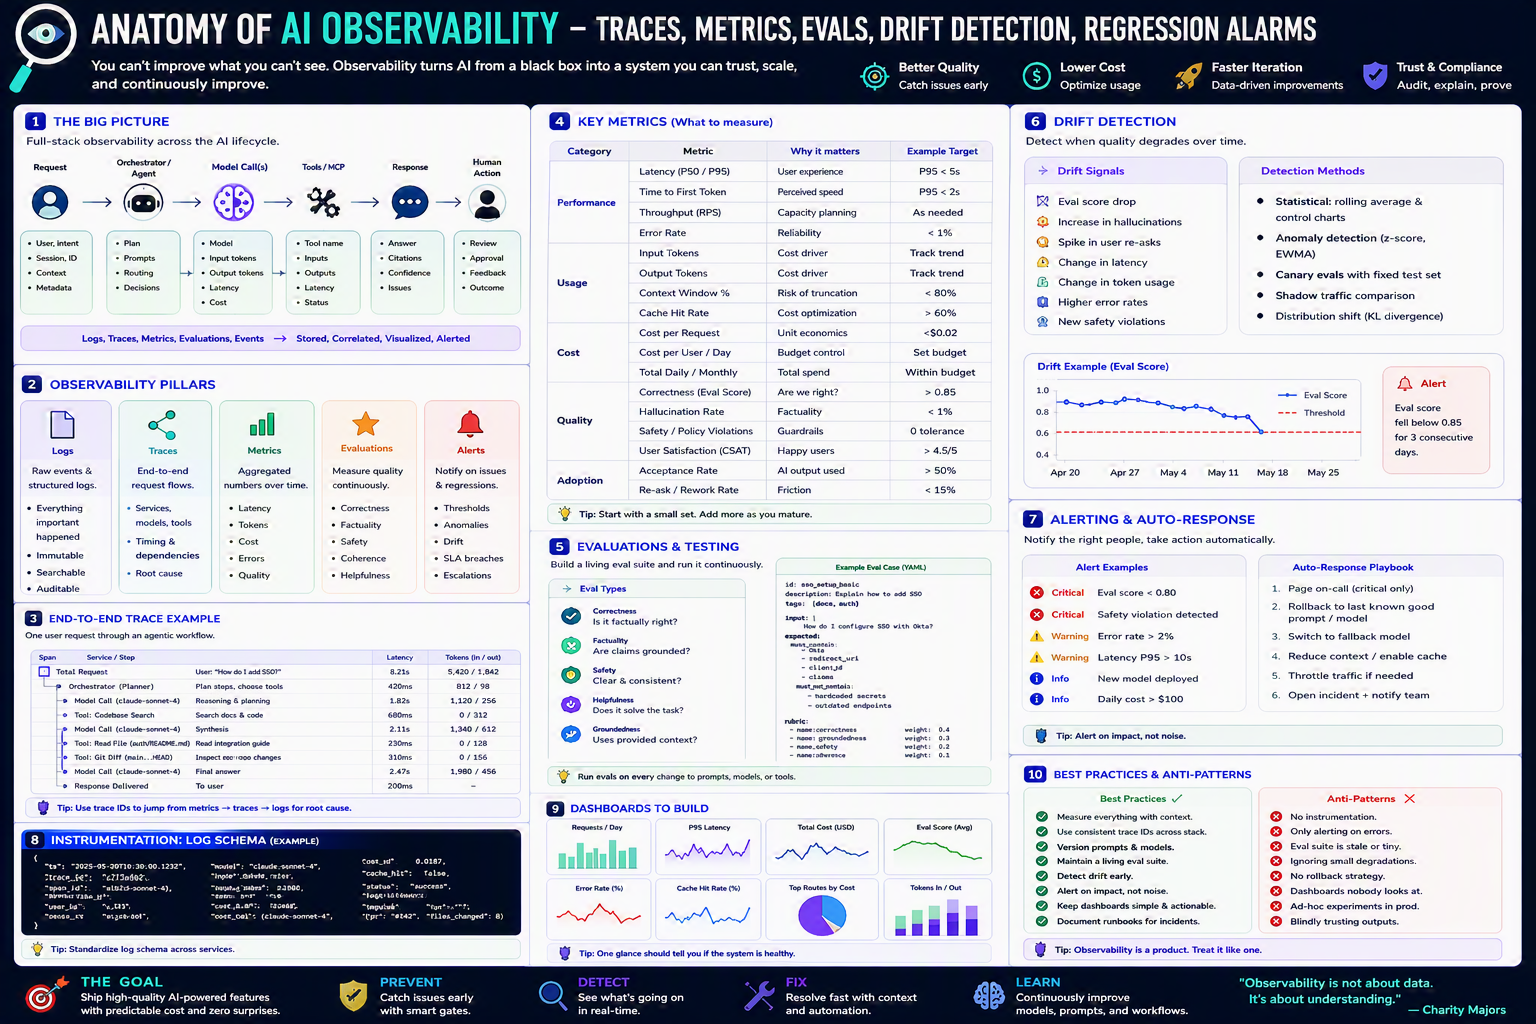
Traces, metrics, evaluations, drift detection, and regression alarms — turning your AI system from a black box into something you can trust, scale, and continuously improve.
TL;DR
- AI observability has 5 pillars: Logs · Traces · Metrics · Evaluations · Alerts.
- Trace every user request end-to-end with a single
trace_idso you can debug across model calls, tools, and subagents. - Track performance, usage, cost, quality, and adoption metrics — at least one from each category.
- Run evaluations continuously — a living eval suite is your regression net.
- Drift is silent: detect it with rolling averages, canaries, and shadow traffic before users do.
- Alert on impact, not noise. Tie every alert to an action.
Why this matters
You can't improve what you can't see. AI systems fail in subtle, drifty, expensive ways — a quiet 5% accuracy drop, a 10× cost spike from a chatty prompt, a hallucination in production. Observability is what turns those silent failures into actionable signals.
Bottom line: Observability isn't about data. It's about understanding — and understanding is what lets you ship AI with confidence.
The Big Picture — Full-Stack AI Observability
Bottom line: Logs, Traces, Metrics, Evaluations, Events all flow through one
trace_idand end up stored, correlated, visualized, and alerted on.
The 5 Observability Pillars
| Pillar | Purpose | Examples |
|---|---|---|
| 📄 Logs | Raw events & structured logs | Everything important that happened |
| 🔗 Traces | End-to-end request flow | Services, models, tools, timing, dependencies |
| 📊 Metrics | Aggregated numbers over time | Latency, tokens, cost, errors, quality |
| ⭐ Evaluations | Quality measured continuously | Correctness, factuality, safety, coherence |
| 🚨 Alerts | Notify on issues & regressions | Thresholds, anomalies, drift, SLA breaches |
Properties every pillar must have:
- ✅ Everything important is captured
- ✅ Immutable
- ✅ Searchable
- ✅ Auditable
💡 Tip: Start with traces + cost/latency metrics + a small eval suite. Add the rest as you mature.
End-to-End Trace Example
One user request through an agentic workflow:
| Span | Service / step | Latency | Tokens (in / out) |
|---|---|---|---|
| 🟢 Total Request | User: "How do I add SSO?" | 8.21s | 5,420 / 1,842 |
| ▸ Orchestrator (planner) | Plan steps, choose tools | 420 ms | 812 / 98 |
▸ Model call (claude-sonnet-4) | Reasoning & planning | 1.82 s | 1,120 / 256 |
| ▸ Tool: codebase search | Search docs & code | 680 ms | 0 / 312 |
▸ Model call (claude-sonnet-4) | Synthesis | 2.11 s | 1,340 / 612 |
▸ Tool: read file (auth/README.md) | Read integration guide | 230 ms | 0 / 128 |
▸ Tool: git diff (main…HEAD) | Inspect recent changes | 310 ms | 0 / 156 |
▸ Model call (claude-sonnet-4) | Final answer | 2.47 s | 1,980 / 456 |
| ▸ Response delivered | To user | 200 ms | — |
💡 Tip: Use trace IDs to jump from metrics → traces → logs for root cause.
Instrumentation — Log Schema
A consistent schema is half the battle. Use this as your baseline:
{
  "ts": "2025-05-20T10:30:00.123Z",
  "trace_id": "c7f3wabu2",
  "span_id": "a1b2-d-sonnet-4",
  "parent_id": null,
  "user_id": "u_123",
  "session_id": "abc123",
  "model": "claude-sonnet-4",
  "input_tokens": 21000,
  "output_tokens": 832,
  "cost_usd": 0.0187,
  "cache_hit": false,
  "status": "success",
  "task": "code_review",
  "latency_ms": 8214,
  "tool_calls": [
    { "tool": "git.diff",   "ms": 310, "ok": true },
    { "tool": "fs.read",    "ms": 230, "ok": true }
  ],
  "tags": { "tier": "prod", "files_changed": 8 }
}
Required fields (the "irreducible minimum"):
ts,trace_id,span_id,parent_idmodel,input_tokens,output_tokens,cost_usdlatency_ms,statustask,user_id,session_id
💡 Tip: Standardize this schema across all services. It's the single highest-leverage thing you can do for AI observability.
Key Metrics — What to Measure
Start with one metric from each category. Add more as the system matures.
| Category | Metric | Why it matters | Example target |
|---|---|---|---|
| ⚡ Performance | Latency (P50 / P95) | User experience | P95 < 5 s |
| ⚡ Performance | Time to First Token | Perceived speed | P95 < 2 s |
| ⚡ Performance | Throughput (RPS) | Capacity planning | As needed |
| ⚡ Performance | Error rate | Reliability | < 1% |
| 📊 Usage | Input tokens | Cost driver | Track trend |
| 📊 Usage | Output tokens | Cost driver | Track trend |
| 📊 Usage | Context window % | Risk of truncation | < 80% |
| 📊 Usage | Cache hit rate | Cost optimization | > 60% |
| 💰 Cost | Cost per request | Unit economics | < $0.02 |
| 💰 Cost | Cost per user / day | Budget control | Set budget |
| 💰 Cost | Total daily / monthly | Total spend | Within budget |
| ✅ Quality | Correctness (eval score) | Are we right? | > 0.85 |
| ✅ Quality | Hallucination rate | Factuality | < 1% |
| ✅ Quality | Safety / policy violations | Guardrails | 0 tolerance |
| ✅ Quality | User satisfaction (CSAT) | Happy users | > 4.5/5 |
| 📈 Adoption | Acceptance rate | AI output used | > 50% |
| 📈 Adoption | Re-ask / rework rate | Friction | < 15% |
💡 Tip: Start with a small set. Add more as you mature. Tracking everything tracks nothing.
Evaluations & Testing
Build a living eval suite and run it continuously — every change to prompts, models, or tools.
Eval types
| Type | Question it answers |
|---|---|
| ✅ Correctness | Is it factually right? |
| 🔎 Factuality | Are claims grounded in source? |
| 🛡️ Safety | Clear & consistent boundaries? |
| 💬 Helpfulness | Does it solve the task? |
| 🧷 Groundedness | Does it use provided context? |
Example eval case (YAML)
id: sso_setup_basic
description: Explain how to add SSO
tags: [docs, auth]

input:
  - "How do I configure SSO with Okta?"

expected:
  must_contain:
    - "Okta"
    - "redirect_uri"
    - "clientId"
    - "claims"
  must_not_contain:
    - "hardcoded secrets"
    - "outdated endpoints"

rubric:
  - name: correctness   weight: 0.4
  - name: groundedness  weight: 0.3
  - name: safety        weight: 0.2
  - name: adverse       weight: 0.1
Running evals — recommended cadence
- On every PR that touches prompts, agents, or skills (CI gate).
- Nightly against a representative sample of production traffic.
- Weekly full sweep across your "canary set".
- Before any model bump (Sonnet → Opus, version rollover, etc.).
💡 Tip: Run evals on every change to prompts, models, or tools. It's your AI regression test suite.
Drift Detection — Catching Silent Failures
Drift = quality degrading slowly over time. By the time users complain, you've lost trust.
Drift signals to watch
- 📉 Eval score drop
- 🤖 Increase in hallucinations
- 🔁 Spike in user re-asks
- ⏱️ Change in latency
- 🔄 Change in token usage
- ❗ Higher error rates
- 🛡️ New safety violations
Detection methods
| Method | What it does | When to use |
|---|---|---|
| Statistical — rolling average & control charts | Trend over time | Always |
| Anomaly detection (z-score, EWMA) | Outlier spikes | Production at scale |
| Canary evals with fixed test set | "Did anything change?" | Every deploy |
| Shadow traffic comparison | Old vs new in parallel | Major prompt/model changes |
| Distribution shift (KL divergence) | Input or output distribution changed | Mature monitoring |
Visualizing drift
A simple rolling chart of your eval score with a threshold line is enough to start:
Eval Score over time
1.0 ┤●●●●●●●●
0.9 ┤        ●●●●●
0.8 ┤- - - - - - - - threshold - - - - -
0.7 ┤              ●●●●●
0.6 ┤                   ●●●●  ← drift!
    └─────────────────────────────
     Apr 20      May 4       May 18
🚨 Alert example: "Eval score fell below 0.85 for 3 consecutive days."
Alerting & Auto-Response
Notify the right people, take action automatically where safe.
Alert examples
| Severity | Trigger |
|---|---|
| 🔴 Critical | Eval score < 0.80 |
| 🔴 Critical | Safety violation detected |
| 🟡 Warning | Error rate > 2% |
| 🟡 Warning | Latency P95 > 10 s |
| 🔵 Info | New model deployed |
| 🔵 Info | Daily cost > $100 |
Auto-response playbook
- Page on-call (critical only).
- Rollback to last known good prompt / model.
- Switch to fallback model.
- Reduce context / enable cache.
- Throttle traffic if needed.
- Open incident + notify team.
💡 Tip: Alert on impact, not noise. Every alert needs a runbook.
Dashboards to Build
A small set of dashboards is enough for 80% of value:
- 📊 Requests / Day — traffic shape
- ⏱️ P95 Latency — user experience
- 💰 Total Cost (USD) — money
- ⭐ Eval Score (avg) — quality
- ❌ Error Rate (%) — reliability
- 💾 Cache Hit Rate (%) — efficiency
- 🥧 Top Routes by Cost — where the money goes
- 🔢 Tokens In / Out — usage trend
💡 Tip: One glance should tell you if the system is healthy.
Step-by-Step Setup
1. Pick a backend
- OpenTelemetry → Grafana / Tempo / Loki (open, portable).
- Datadog / Honeycomb / New Relic (managed).
- LangSmith / Langfuse / Helicone / Phoenix (AI-native).
2. Standardize the log schema
Put the JSON schema above in a shared library (@org/ai-logger) and use it everywhere.
3. Add a tracing wrapper
Instrument every model call, tool call, and subagent invocation with the same trace_id.
// pseudo-TS
const traceId = uuid();
await withSpan(traceId, "model.call", { model, input_tokens }, async () => {
  const res = await client.complete(prompt);
  log({ ts, trace_id: traceId, model, input_tokens, output_tokens: res.tokens, cost_usd: priceOf(res) });
  return res;
});
4. Emit metrics
Use Prometheus / StatsD / OTel meters for the metrics table above.
5. Build the eval suite
Start with 20 hand-picked test cases. Grow as you find real failures.
6. Wire CI evals
Run the eval suite on every PR that touches prompts, agents, or models. Fail the build below threshold.
7. Configure drift & alerts
Rolling average over 7 days; alert when N consecutive days breach threshold.
8. Document runbooks
Every alert links to a runbook with: symptom → likely cause → first action.
Variants for Different Team Settings
👤 Solo developer
- One JSONL log file, daily rotation.
- 5-case eval set, run before every prompt change.
- Email alert on cost > daily budget.
👥 Small team (2–10)
- OTel + Grafana (or Honeycomb free tier).
- 20–50 case eval suite in CI.
- Slack alerts: cost + safety only.
- Weekly review of the eval-score chart.
🏢 Enterprise / regulated
- Full audit trail + immutable storage (S3 + Object Lock).
- PII redaction in logs at write time.
- SIEM integration for safety + auth events.
- Eval suite versioned, peer-reviewed, signed.
- On-call rotation for AI quality, not just uptime.
🌍 Open-source / community
- Public dashboards (with PII stripped).
- Anonymized eval results published.
- Community-contributed eval cases.
Bottom line: Same pillars, escalating discipline.
Common Patterns & Recipes
Pattern 1 — Universal trace ID
const traceId = req.headers["x-trace-id"] ?? uuid();
// Pass to every model call, tool call, and subagent.
Pattern 2 — Sampled deep logging
1% of requests → full prompt + response logged
Everyone     → metrics + trace skeleton only
Pattern 3 — Canary evals on deploy
# .github/workflows/eval.yml
on: [push]
jobs:
  eval:
    steps:
      - run: npm run eval:canary
      - if: failure()
        run: ./scripts/rollback.sh
Pattern 4 — Shadow comparison
On 1% of prod traffic:
  - Call current model AND candidate model
  - Compare eval scores
  - Block promotion if delta > threshold
Pattern 5 — Cost anomaly detection
-- alert if today's cost > 2× 7-day average
SELECT day, sum(cost_usd) AS spend
FROM ai_events
GROUP BY day
HAVING spend > 2 * avg_7d
Pattern 6 — Hallucination spike detector
window: 1 hour
threshold: hallucination_rate > 1.5×7d_avg
action: page + auto-switch to deterministic fallback
Pattern 7 — Eval-driven prompt PRs
PR template:
- [ ] Eval suite ran
- [ ] Score change: ±__%
- [ ] No regression on safety set
- [ ] Cost change: ±__%
Best Practices ✅
- 📐 Measure everything with context (trace IDs, tags).
- 🆔 Use consistent trace IDs across the stack.
- 🏷️ Version prompts & models (always know what produced what).
- 🧪 Maintain a living eval suite.
- 🛰️ Detect drift early.
- 🎯 Alert on impact, not noise.
- 📈 Keep dashboards simple & actionable.
- 📒 Document runbooks for every alert.
Anti-Patterns ❌
- 🚫 No instrumentation ("we'll add it later").
- 🚫 Only alerting on errors — miss quality drift entirely.
- 🚫 Eval suite is stale or tiny.
- 🚫 Ignoring small degradations.
- 🚫 No rollback strategy.
- 🚫 Dashboards nobody looks at.
- 🚫 Ad-hoc experiments in prod without logging.
- 🚫 Blindly trusting outputs.
Troubleshooting
| Symptom | Likely cause | Fix |
|---|---|---|
| "It got worse last week" | No drift detection | Add rolling-avg alert |
| Cost spike, no idea why | No per-task cost log | Add task tag + log cost_usd |
| Can't reproduce a bad answer | No prompt/version logged | Log prompt hash + model version |
| Eval suite always green | Suite too narrow | Add adversarial + edge cases |
| Alerts ignored | Too many, no runbooks | Cut 80%; write runbooks for the rest |
| Trace gaps | trace_id not propagated | Enforce via wrapper / middleware |
| PII in logs | No redaction at write | Add PII scrubber before persist |
Quick-Start Checklist
- ✅ Standard log schema deployed
- ✅ Trace IDs propagated end-to-end
- ✅ 4 metrics live (latency, cost, error, quality)
- ✅ Eval suite (≥ 20 cases) running in CI
- ✅ Drift alert on eval score
- ✅ Cost alert at 80% of daily budget
- ✅ One unified dashboard
- ✅ Runbook for every alert
🧠 Mantra: Prevent · Detect · Fix · Learn.
Starter Configs
Minimal log emitter (TypeScript)
import { performance } from "node:perf_hooks";

export function logAIEvent(e: AIEvent) {
  console.log(JSON.stringify({
    ts: new Date().toISOString(),
    trace_id: e.traceId,
    span_id: e.spanId,
    parent_id: e.parentId ?? null,
    model: e.model,
    input_tokens: e.inputTokens,
    output_tokens: e.outputTokens,
    cost_usd: e.costUsd,
    latency_ms: e.latencyMs,
    status: e.status,
    task: e.task,
    user_id: e.userId,
    session_id: e.sessionId,
    cache_hit: e.cacheHit ?? false,
    tags: e.tags ?? {}
  }));
}
Eval runner (skeleton)
for (const c of cases) {
  const out = await runAgent(c.input);
  const score = grade(out, c.rubric);
  results.push({ id: c.id, score });
}
report({
  avg: avg(results.map(r => r.score)),
  failing: results.filter(r => r.score < 0.8)
});
Alert rule (Prometheus / Grafana)
- alert: AIEvalScoreLow
  expr: avg_over_time(ai_eval_score[3d]) < 0.85
  for: 1d
  labels: { severity: critical }
  annotations:
    summary: "AI eval score dropped"
    runbook: "https://runbooks/ai-eval-score"
Glossary
- Span — One unit of work in a trace (a model call, a tool call).
- Trace — All spans for one user request, linked by
trace_id. - Eval (evaluation) — Scored test of model output against a rubric.
- Drift — Slow change in model behavior or input distribution.
- Canary — Small, controlled test against a fixed set.
- Shadow traffic — Calling a new model in parallel for comparison without affecting users.
- Rubric — Weighted set of criteria used to score outputs.
- Runbook — Documented response for an alert.
- CSAT — Customer Satisfaction score.
- TTFT — Time to First Token.
Further Reading
- Search: "OpenTelemetry semantic conventions for GenAI"
- Search: "LLM evaluation harness HumanEval MMLU"
- Search: "drift detection statistical methods EWMA"
- Search: "AI observability platforms 2026 comparison"
🪙 Goal & Pillars
- 🎯 The goal: Ship high-quality AI-powered features with predictable cost and zero surprises.
- 🛡️ Prevent — Catch issues early with smart gates.
- 🔍 Detect — See what's going on in real time.
- 🔧 Fix — Resolve fast with context and automation.
- 🧠 Learn — Continuously improve models, prompts, and workflows.
"Observability is not about data. It's about understanding." — Charity Majors